Components
Radial bar chart
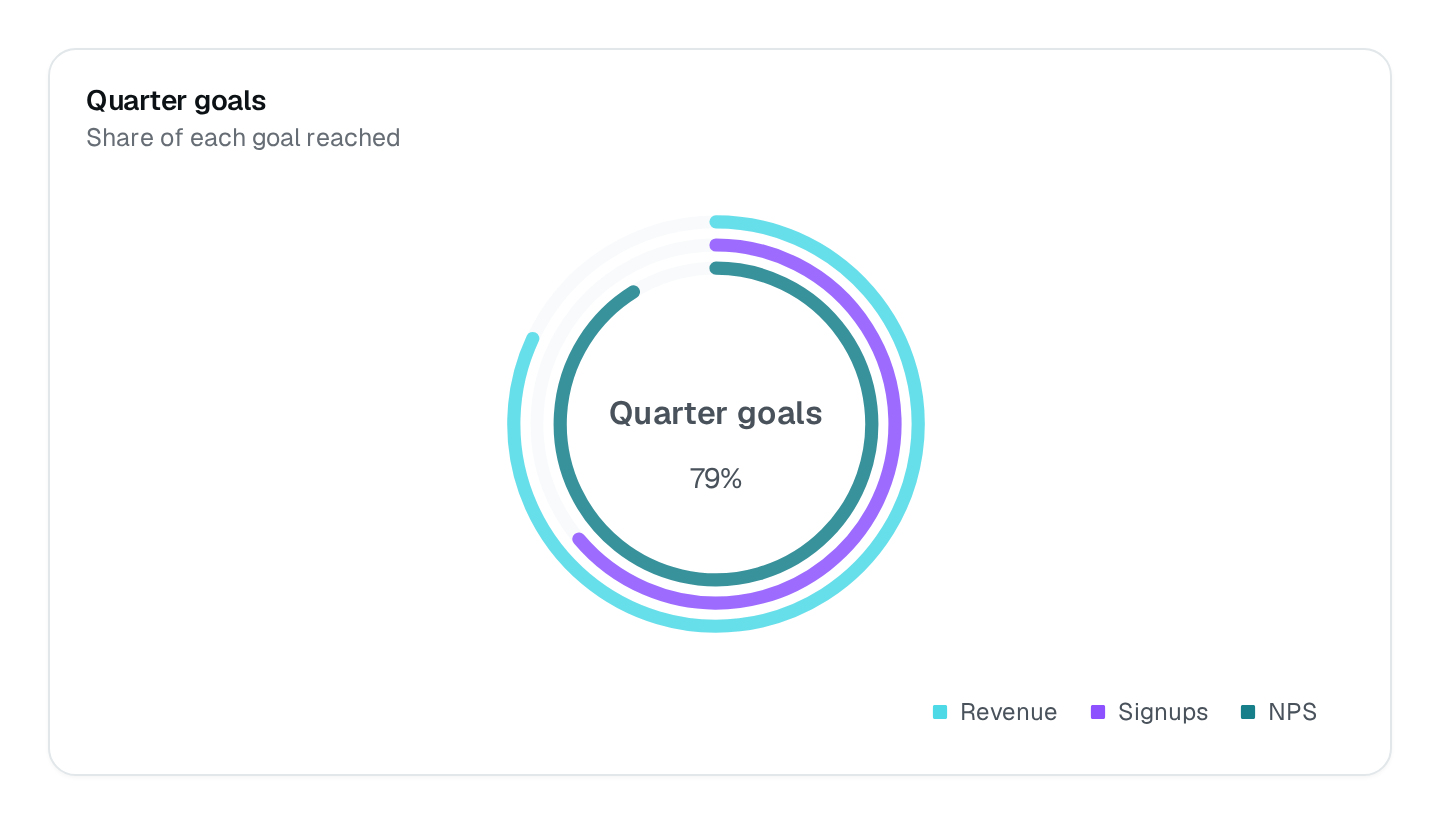
Progress of a few measures towards 100 %, as concentric rings.
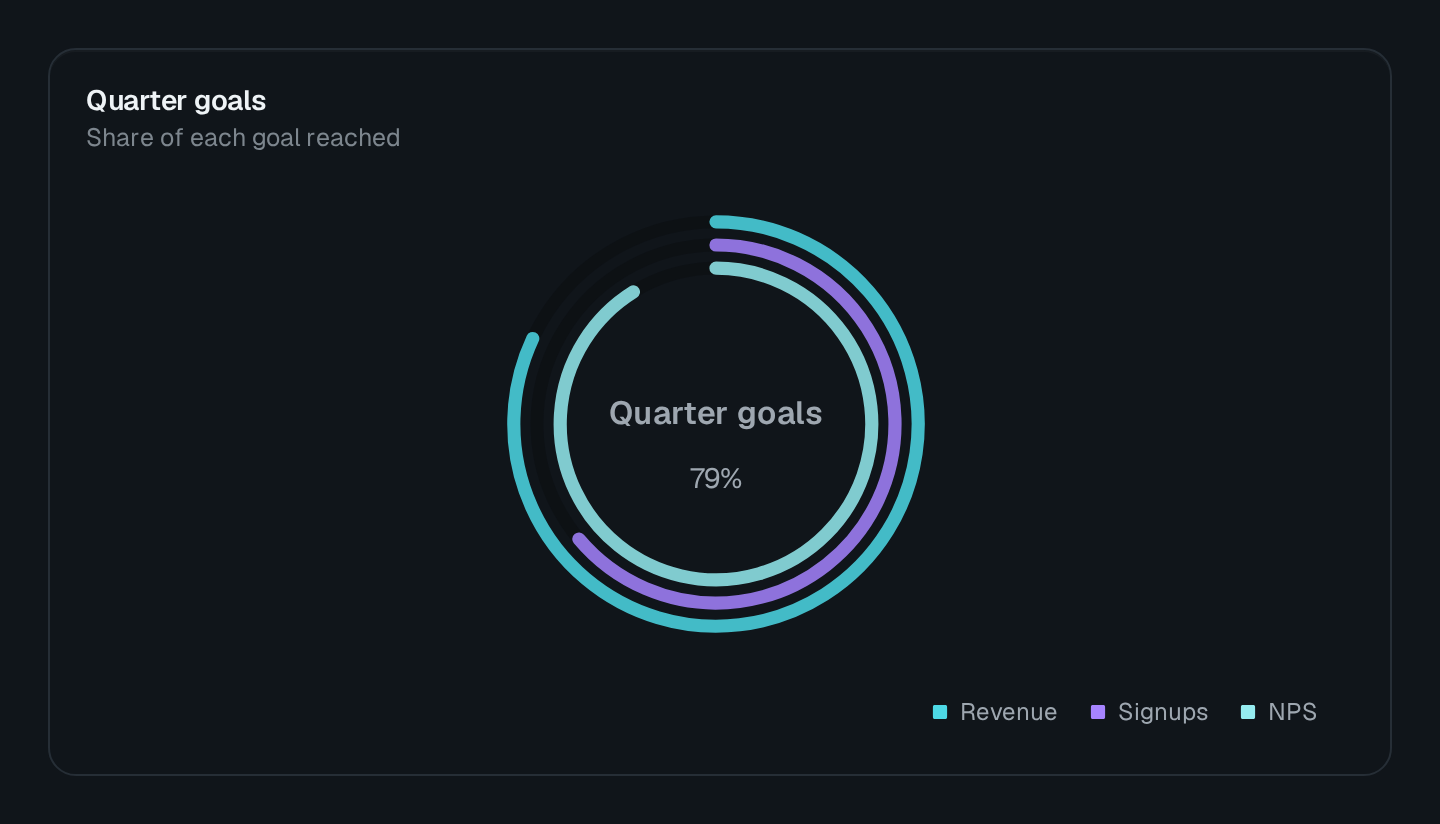
ChartRadialBar draws each record as a ring filled to its value, in percent. Use it for the progress of a few measures towards a goal — onboarding steps, quotas — with showTotal to label the middle with the chart's title and total.
ChartRadialBar Connecting to the DMS preview…
Usage
src/pages/dashboard.ts
import { ChartRadialBar } from "@antelopejs/interface-dms/base/chart";

static onboarding = ChartRadialBar({
  title: "$app.onboarding.completion",
  fetchUrl: "/api/onboarding/completion",
  showTotal: true,
});
The route answers { series } in the shape listed under Data shapes. Wrap the chart in a ChartCard to add a headline value and a comparison.
Options
| Option | Type | Default | Description |
|---|---|---|---|
titleContent | string | – | |
descriptionContent | string | – | |
colorAppearance | string | string[] | – | |
heightAppearance | string | – | |
widthAppearance | number | – | |
showTooltipAppearance | boolean | true | |
showLegendAppearance | boolean | true | |
legendPositionAppearance | "top" | "bottom" | – | |
hollowSizeAppearance | string | – | |
showTotalAppearance | boolean | – |
Recipes
One measure
A single record makes a gauge: one ring and its value in the middle.