Components
Pie chart
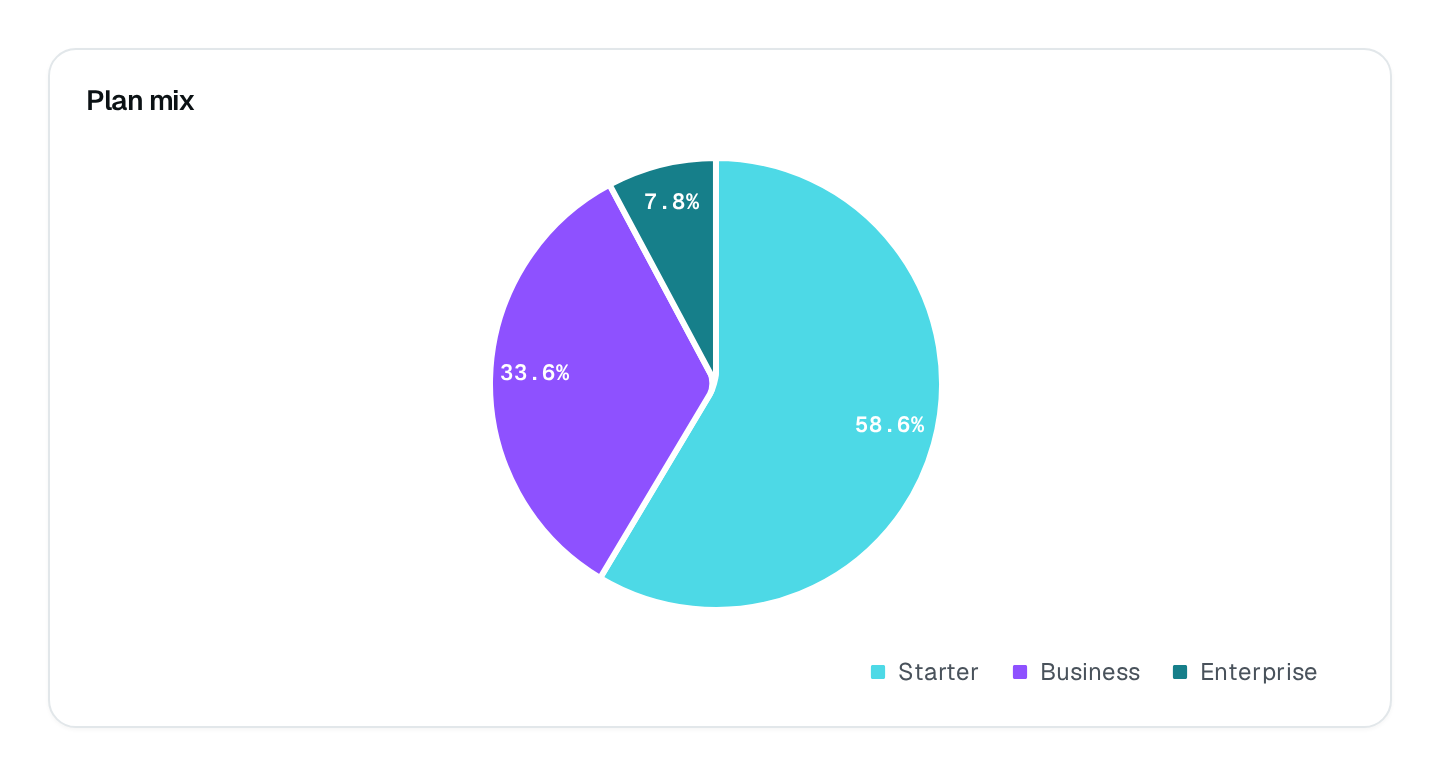
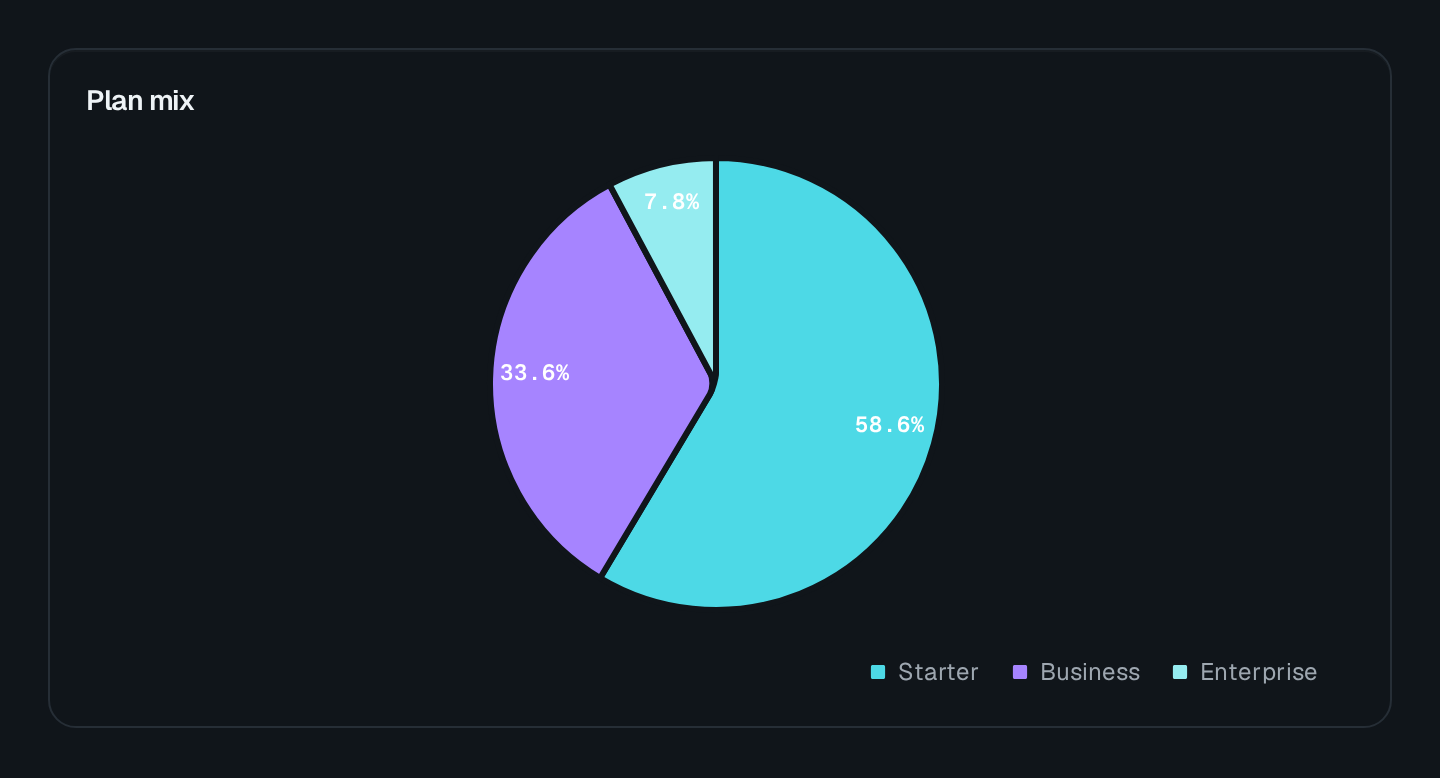
Parts of a whole as slices, each labelled.
ChartPie draws parts of a whole as slices and always labels them. Prefer a donut when a total belongs in the middle.
ChartPie Connecting to the DMS preview…
Usage
src/pages/dashboard.ts
import { ChartPie } from "@antelopejs/interface-dms/base/chart";

static sources = ChartPie({
  title: "$marketing.traffic.sources",
  fetchUrl: "/api/marketing/traffic/sources",
});
The route answers { series } in the shape listed under Data shapes. Wrap the chart in a ChartCard to add a headline value and a comparison.
Options
| Option | Type | Default | Description |
|---|---|---|---|
titleContent | string | – | |
descriptionContent | string | – | |
colorAppearance | string | string[] | – | |
heightAppearance | string | – | |
widthAppearance | number | – | |
showTooltipAppearance | boolean | true | |
showLegendAppearance | boolean | true | |
legendPositionAppearance | "top" | "bottom" | – |
Recipes
Keep slices few
Group the long tail into "Other" on the server: past six slices a pie stops reading.