Components
KPI card
One headline figure with its variation versus the comparison period and an optional sparkline.
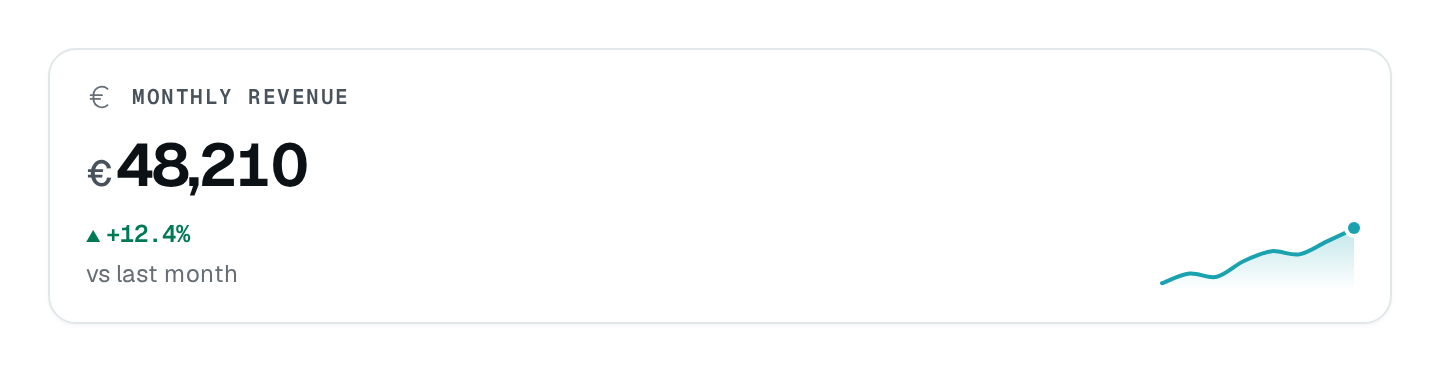
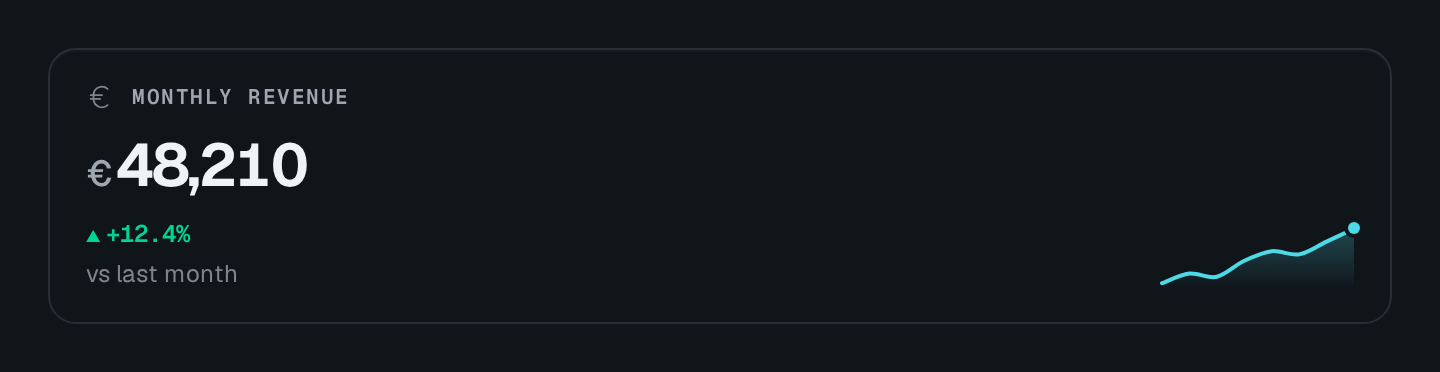
KpiCard headlines one metric followed over a period: a large formatted value, a colored up / down delta badge with its comparison caption, and an optional inline sparkline. The stat variant is the tighter DMS look, with a mono uppercase label and a bare icon.
KpiCard Connecting to the DMS preview…
Usage
src/pages/sales.ts
import { KpiCard } from "@antelopejs/interface-dms/base/kpi-card";

static revenue = KpiCard({
  title: "$shop.sales.revenue",
  icon: "i-ph-currency-eur",
  fetchUrl: "/api/sales/revenue",
  periodScope: "sales",
  valueFormat: "currency",
  currencyCode: "EUR",
  showDelta: true,
  showSparkline: true,
});
The route answers the value, its variation and the sparkline points:
src/pages/sales.ts
@Get("revenue")
revenue() {
  return { value: 48200, delta: 12.4, previousValue: 42900, sparkline: [31, 34, 33, 38, 41, 39, 44, 48] };
}
Options
| Option | Type | Default | Description |
|---|---|---|---|
title*Content | string | – | Card heading. |
descriptionContent | string | – | Secondary line under the value. |
compareLabelContent | string | – | |
iconAppearance | string | – | The icon shown on the card. |
variantAppearance | "default" | "stat" | – | Stat draws the card in a compact style. |
valueFormatAppearance | "number" | "currency" | "percent" | "compact" | – | |
currencyCodeAppearance | string | – | The currency, as a three-letter code such as EUR, when the value is an amount. |
showDeltaAppearance | boolean | – | |
showSparklineAppearance | boolean | – | |
sparklineAccentAppearance | string | – | |
invertBehavior | boolean | – | Treat a falling value as the good outcome. |
valuePrecision is available in code (Value precision).
Recipes
A metric where down is good
Set invert: true for errors, churn or latency: a falling value then reads green.
A static card
Pass staticValue, staticDelta and staticSparkline instead of fetchUrl for a fixture or a demo.
Pitfalls
deltais a change in percent (12.5), not a ratio (0.125).- For several figures read at a glance, without a period, use a
StatGroup: itscardslayout draws the same compact card asKpiCard({ variant: "stat" }).