Overview
Overview dashboard
Where: /modules/marketing/overview — the module's landing page, first
under the Analytics heading.
The overview answers "how is the site doing" for one website over a chosen period: traffic volume, where visitors come from, and what they use.
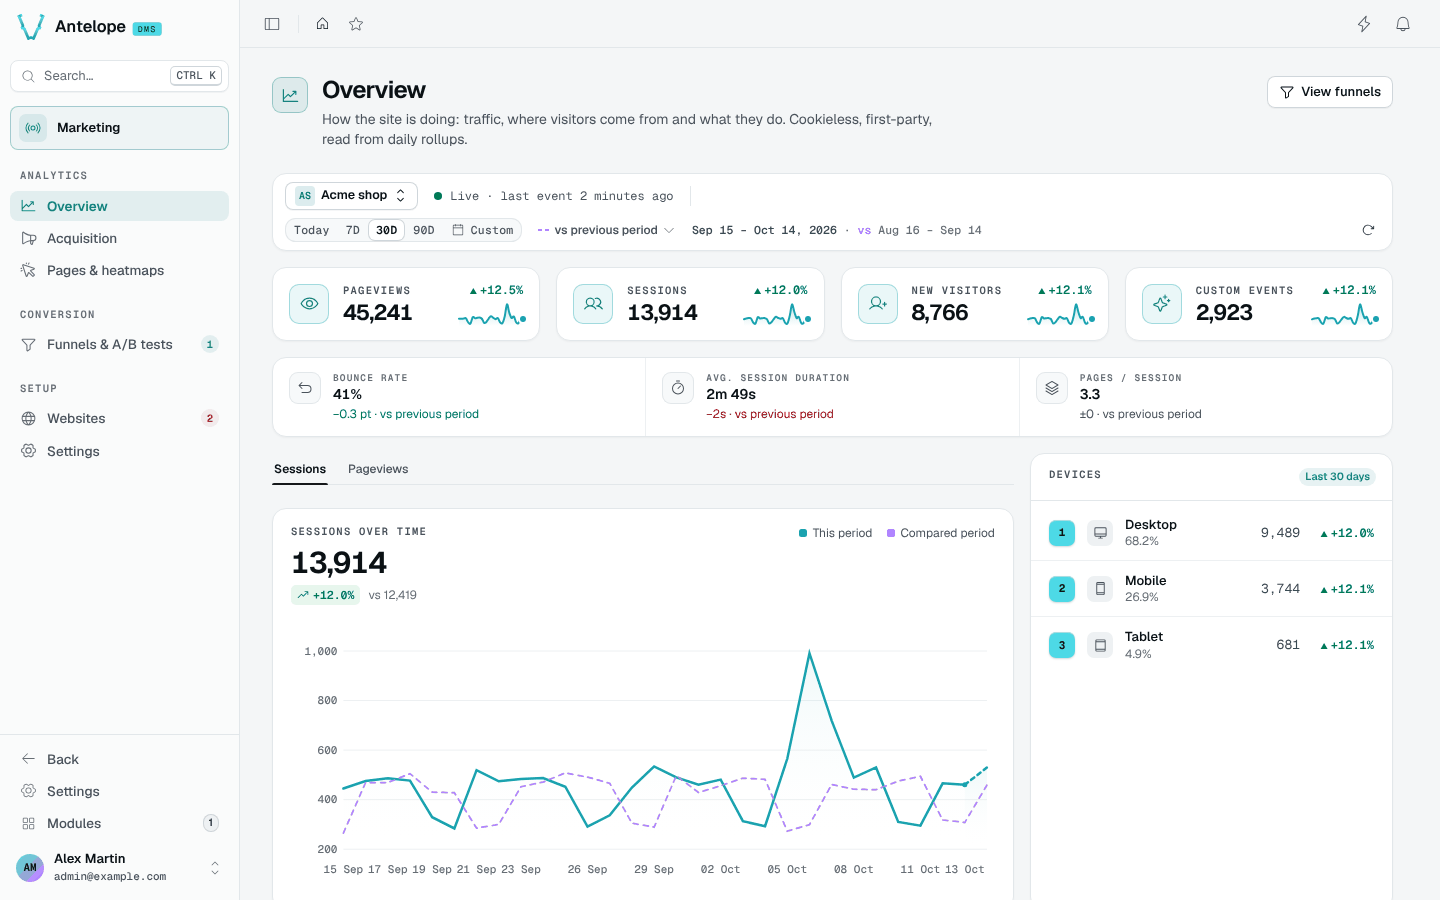
The context bar
Every analytics page (Overview, Acquisition, Pages & heatmaps, Funnels) opens on the same bar, and every block of the page reads what it picks:
- Website — the switcher lists the workspace's sites with their state: Live · last event … once a pageview has arrived, Waiting for the first event before that, Tracking paused for this website when the site's own switch is off. A site whose data all comes from an import reads Imported history · last event … until the tag sends something newer. The pick is also stored server-side per member, as the site of the pages opened without one. Until you pick one, the most recently active site is shown.
- Period — Today, 7D, 30D, 90D or a custom range picked in a calendar;
30 days by default.
MAX_QUERY_PERIOD_DAYS(90) bounds every window: a longer range is cut at its start. Statistics are counted per UTC day; the UTC hint says when your days start. - Comparison — the previous period (default), the same period a year earlier, or none. The bar shows the resolved ranges of both.
- Refresh — refetches every block of the page.
The website, period and comparison are in the page URL
(?website=…&marketing.period=…&marketing.compare=…), so a copied link opens
on the same view and each tab keeps its own. Links between the module's
pages carry them; a page opened from the sidebar starts from your last
choice on it. While the workspace has no website, a first-run screen with
Add a website replaces the page's blocks.
What it shows
- KPI cards — pageviews, sessions, new visitors and custom events for the period, each with its change against the comparison window and a daily sparkline.
- Session quality — bounce rate (share of sessions that never passed one pageview; its change reads in points, and a decrease reads as the good direction), average session duration (observed activity span — last beacon minus first) and pages per session.
- Traffic chart — sessions per day, the comparison window drawn dashed behind the period.
- Devices — sessions by device type, with their share.
- Top lists — four tabbed cards, each footer leading to the surface that
owns the detail:
- Content — top pages, entry pages (first page of each session) and exit pages (last page seen so far — it follows the session while it lives); a click on a page opens its heatmap on Pages & heatmaps.
- Acquisition — channels (the direct / organic / social / email / referral / paid split), campaigns and referrers; the footer opens the Acquisition page.
- Audience — browsers and languages (as the visitors' browsers
report them, shown as readable names). A Countries tab joins them
when the deployment configures a GeoIP database (
geoipDatabasePath, see Installation): the country is derived from the IP at collection and stored as a code — the IP itself never is. Without one, the tab still shows when the period has sessions with a country, such as history imported withImportAnalytics. - Custom events — custom event names ranked by trigger count, the breakdown behind the custom-events KPI (Tracker & custom events). An event that is the last step of a funnel of the site is tagged Goal; the footer opens the funnel builder.
Everything is ranked over the selected period.
The header's View funnels action leads to Funnels & A/B tests.
Where the numbers come from
Every panel reads the daily rollups (marketing_website_statistics),
never raw events — the dashboard stays fast regardless of traffic volume, and
keeps working after raw events expire. A few consequences worth knowing:
- Periods are whole days, in UTC. The bounds the context bar sends are mapped on the UTC days carrying the same dates, which is what rollup rows are keyed on.
- Top lists are capped. A day keeps at most
MAX_ENTRIES_PER_TOP_MAP(50) entries per list. Top maps are emptied afterTOP_MAPS_RETENTION_DAYS(455 days), allowing a 90-day window to be compared with the previous year when the configured statistics retention still covers it. Scalar counters follow that statistics retention. Totals are exact; long-tail entries in top lists are not. - Referrers are acquisition sources, not navigation. A referrer matching
the website's
domain— or any hostname the batch was tracked from — is dropped at ingestion, never counted as a source. - Counters added later start at their ship date. Rollup days written before bounce, duration or the entry/exit and events dimensions existed read as zero for them; a window overlapping that boundary understates those metrics, never the traffic ones.
See Architecture for how the rollups are written.