Mailing
Overview
Read delivery and engagement figures for every e-mail your workspace sends.
The Overview is the module's landing page. It answers "are our e-mails reaching people?" for the selected period (7, 30 or 90 days), compared with the previous one. Test sends are left out of every figure.
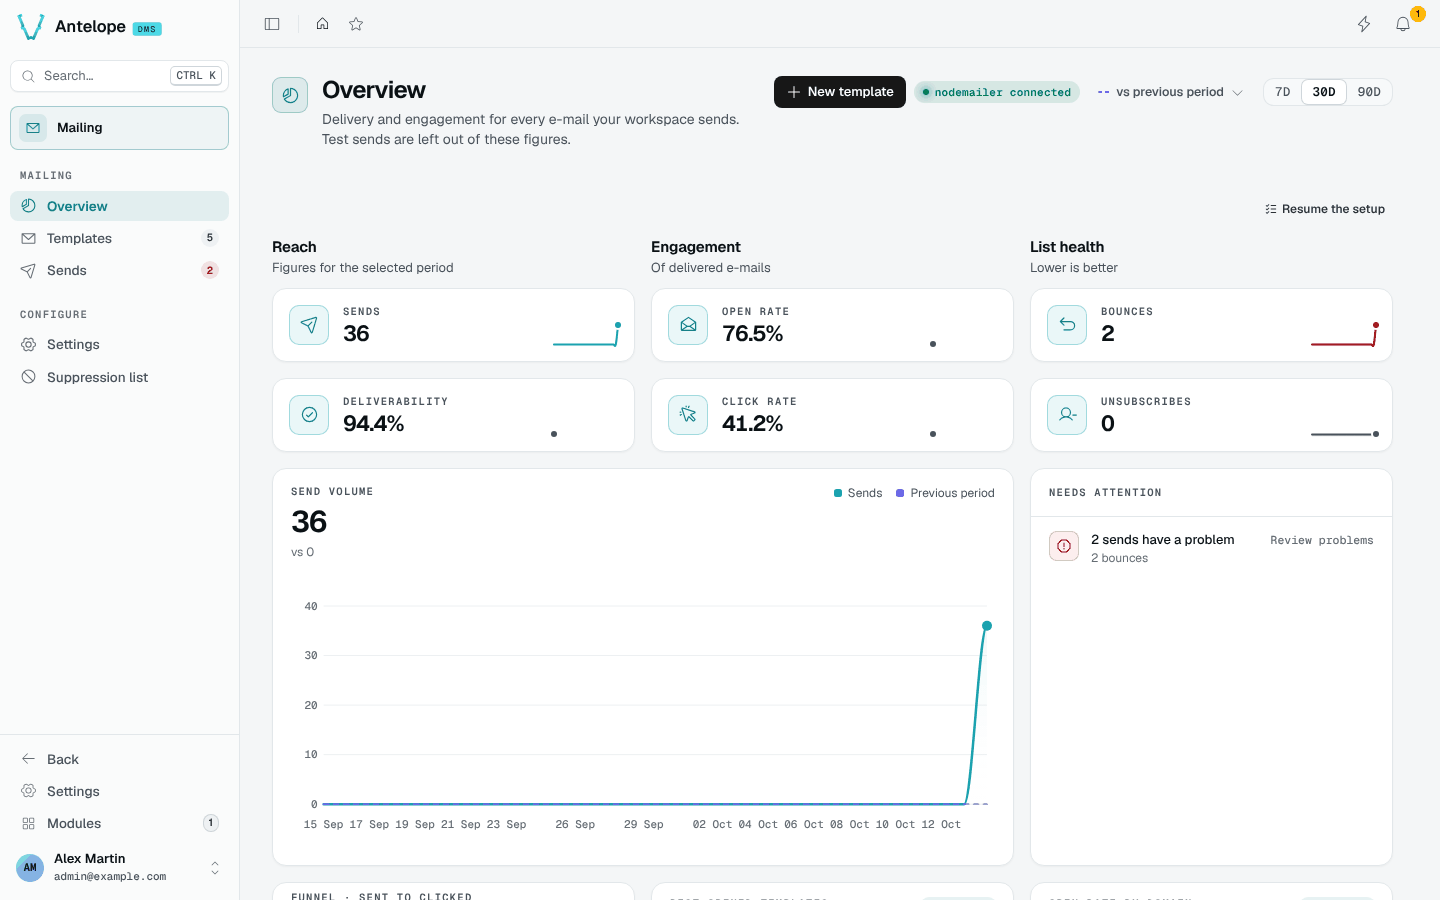
Figures
| Group | KPI | Meaning |
|---|---|---|
| Reach | Sends | E-mails sent in the period |
| Reach | Deliverability | Share of sends the provider delivered |
| Engagement | Open rate | Share of delivered e-mails opened |
| Engagement | Click rate | Share of delivered e-mails clicked |
| List health | Bounces | Lower is better |
| List health | Unsubscribes | Lower is better |
The Send volume chart plots the sends per day against the previous period.
Below the fold
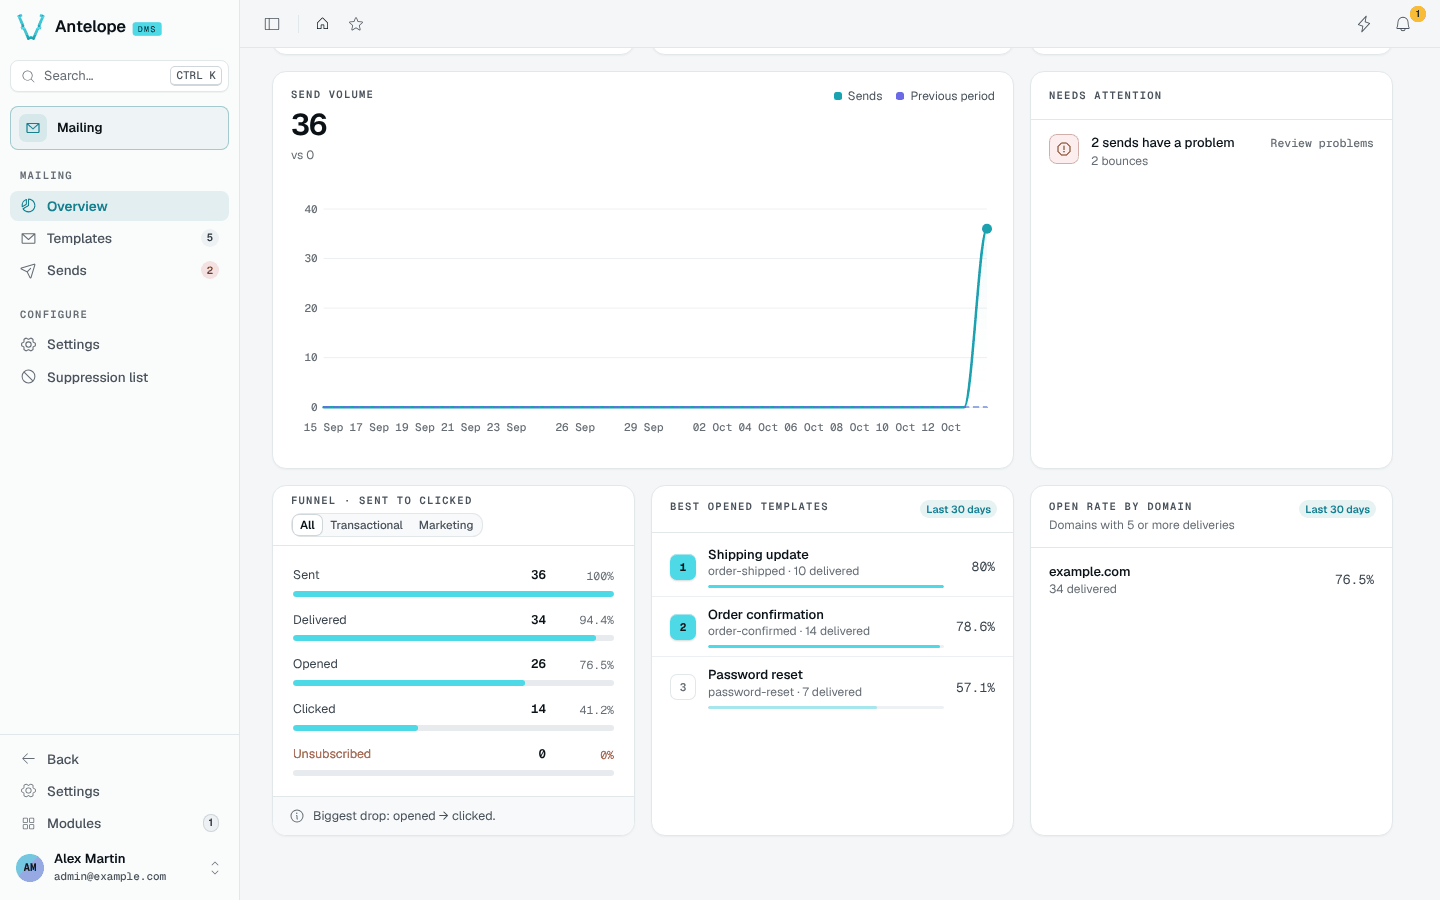
- Needs attention lists what to act on (sends with a problem, templates missing a workspace locale), each with a verb such as Review problems, which opens the Sends page on its Problems tab.
- Funnel · sent to clicked shows each step with its count and rate, for all templates, transactional ones or the
marketingcategory, and names the biggest drop. - Best opened templates and Open rate by domain (domains with 5 or more deliveries) cover the last 30 days.
Header
The header shows whether the provider is connected, the comparison period, the period switch and New template. Until the workspace has a provider and a template, the page shows a setup checklist instead; Resume the setup reopens it later.