A Chart Without Code
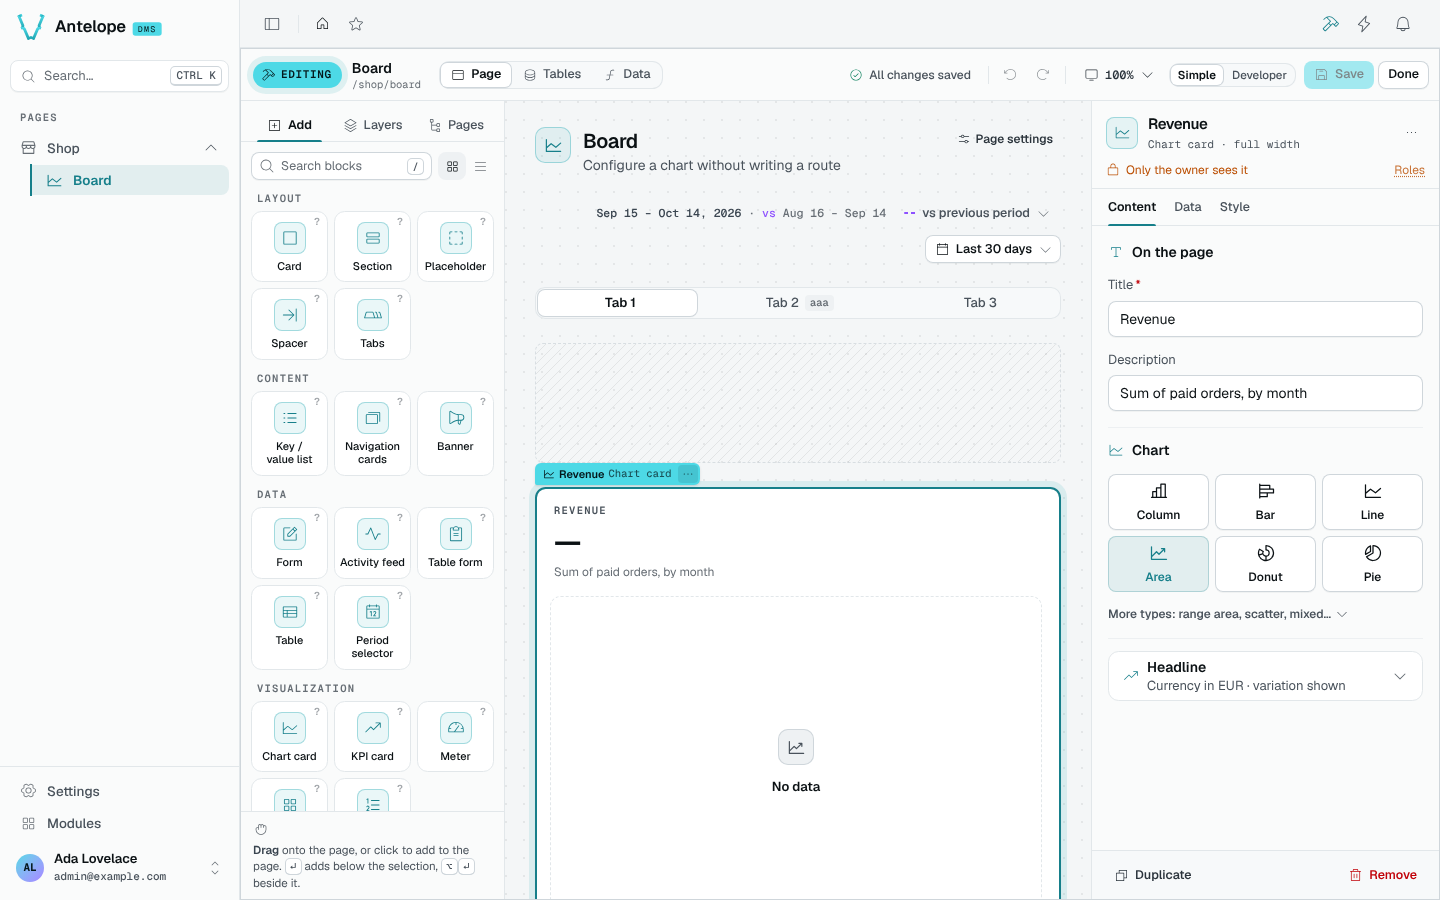
You need an existing /shop/board page and an order resource with numeric
amount, date createdAt and status fields. Run these calls inside a project
that loads the builder. Use a disposable page for the save example: its draft
replaces the page's existing blocks.
The result is a revenue chart grouped by month. Start with all paid orders; add period controls and comparison only after this first chart works.
Show the data before writing anything
While the person is still choosing, PreviewQuery runs the calculation against
the real table and answers what the route would:
import { PreviewQuery } from "@antelopejs/interface-dms-builder";

const preview = await PreviewQuery({
  query: {
    name: "revenueChart",
    resource: "order",
    template: "series",
    params: {
      op: "sum",
      field: "amount",
      groupBy: "createdAt",
      bucket: "month",
      timezone: "Europe/Brussels",
      where: [{ field: "status", op: "eq", value: "paid" }],
    },
    response: "card",
  },
});
if (preview.ok) {
  console.log(preview.data.body); // Chart-card data from the current rows
  console.log(preview.data.truncated);
} else {
  console.error(preview.error);
}
Nothing has been written yet. On success, preview.data.body has the response
shape the chart card reads, including its headline figure. The saved route uses
the same calculation, but its values can change as rows change. Check truncated
before treating a limited preview as a complete result. For a per-tenant resource,
also pass the tenant id in PreviewQuery's tenant option.
Save the block and its data together
The query travels in the page draft, so one save writes the block, the model method and the route in a single transaction:
import { GetPageStructure, SetPageBlocks } from "@antelopejs/interface-dms-builder";

const current = await GetPageStructure("/shop/board");
if (!current.ok) throw new Error(current.error.code);

const saved = await SetPageBlocks("/shop/board", {
  blocks: [
    {
      name: "revenueCard",
      type: "ChartCard",
      config: {
        title: "Revenue",
        fetchUrl: "/dms/pages/shop/board/stats/revenue-chart",
        chart: {
          $block: { type: "ChartArea", config: { xaxisType: "category" } },
        },
      },
    },
  ],
  queries: [
    {
      name: "revenueChart",
      resource: "order",
      template: "series",
      params: {
        op: "sum",
        field: "amount",
        groupBy: "createdAt",
        bucket: "month",
        timezone: "Europe/Brussels",
        where: [{ field: "status", op: "eq", value: "paid" }],
      },
      response: "card",
    },
  ],
}, { expectedVersion: current.data.version });
if (!saved.ok) throw new Error(saved.error.code);
After the backend reloads, open /shop/board as a tenant owner. The card reads
/dms/pages/shop/board/stats/revenue-chart and shows the saved calculation.
Either the blocks and query save together or neither changes.
Two details the engine will hold you to. The block and the query cannot share a
name: both become members of the page class, so a query named after the block it
feeds comes back as duplicate_name in the query scope — name the block for
what it is and the query for what it answers. And a ChartCard requires the
chart it wraps, so a config without chart fails the save on typecheck_failed
rather than on a validation message.
Reference: add a period and comparison
The first example intentionally has no period filter. To make the chart follow a
page period, add periodScope: "page" to the card, bind from and to in the
query's date filters, and supply the page's period selector. Set compare: true
only when requests also supply compareFrom and compareTo. Pass the same filters
and arguments to PreviewQuery to preview that period, rather than all paid orders.
See request-time bindings.
With those period filters added, the generated code has the following shape. These fragments illustrate the model method and route; they are not extra files you need to write for the walkthrough.
A method on the resource's model:
revenueChart(minCreatedAt: Date, maxCreatedAt: Date) {
  return this.table
    .filter((row) => row.key("status").eq("paid"))
    .filter((row) => row.key("createdAt").ge(minCreatedAt))
    .filter((row) => row.key("createdAt").le(maxCreatedAt))
    .map((row) => ({
      bucket: row.key("createdAt").year("Europe/Brussels").mul(100).add(row.key("createdAt").month("Europe/Brussels")),
      value: row.key("amount"),
    }))
    .group("bucket", (rows, group) => ({ x: group, y: rows.sum("value") }))
    .orderBy("x", "asc");
}
And a route on the page, guarded with the page's own permission:
@Get("/stats/revenue-chart")
async revenueChart(
  @AuthUserWithPermission(BoardPage) _user: User,
  @Model(OrderModel) model: OrderModel,
  @Parameter("from", "query") from: string,
  @Parameter("to", "query") to: string,
  @Parameter("compareFrom", "query") compareFrom: string,
  @Parameter("compareTo", "query") compareTo: string,
): Promise<ChartCardData> {
  return chartCardData(
    await model.revenueChart(new Date(from), new Date(to)),
    {
      measure: "sum",
      label: "Amount",
      previous: await model.revenueChart(new Date(compareFrom), new Date(compareTo)),
    },
  );
}
Ordinary code, in the application's own style, that a developer can read, edit and own.
label is what a legend and a tooltip call the series. The builder takes it from
the field being measured — the label the resource gives it — and from the resource
itself for a count, which has no field to name: left out, the helper falls back to
the measure's own word, and a reader who never asked for one would be shown "sum".
Reopen it
GetPageStructure reads the route and its chain back into the parameters that
produced them, so the editor reopens filled in rather than empty:
import { GetPageStructure } from "@antelopejs/interface-dms-builder";

const structure = await GetPageStructure("/shop/board");
if (structure.ok) {
  const source = structure.data.queries.find((q) => q.name === "revenueChart");
  console.log(source?.template); // "series"
  console.log(source?.response); // "card"
  console.log(source?.params); // Saved parameters, including explicit ordering
}
That read-back is what makes the journey repeatable rather than one-way. It is
also what decides ownership: a chain edited past what the grammar accepts reads as
opaque, and from then on the builder will list it and remove it but never
rewrite it.
Where each guarantee lives
| Guarantee | Where it comes from |
|---|---|
| Preview and saved queries use the same calculation | One QueryPlan, rendered by the emitter and run by the executor; rows and preview limits can differ |
| The block and its data save together | PageDraft.queries, written in the page's transaction |
| Reopening shows what was configured | The chain reads back into its parameters |
| A developer's edit survives | An unreadable chain is opaque, and opaque is never rewritten |
| The data is not public | The route carries the page's permission |
| A tenant reads its own rows | The model provider is chosen from the resource's schema |
Reference: what the block asks for
A block declares the response shape it can read beside its factory. The editor uses this catalog metadata to offer compatible calculations and find the option that controls the period:
fetchUrl: ui(z.string().optional(), {
  label: "Data source",
  group: "data",
  widget: "dataSource",
  responseShape: "card",
  periodOption: "periodScope",
});
This is a schema fragment for a block author, not configuration to pass to
AddBlock. An editor consumer reads it from the catalog.
Drafts and Preview
Use PreviewLayout to inspect a page draft without writing files, then SetPageBlocks to save its complete block tree in one transaction. A successful preview does not mean the draft compiles: the write performs that check.
Introduction
Inspect, browse, query and fix the data of every schema your modules register, from the DMS dashboard.