API
Request logs
Search and filter every captured request, then open one to read its error, timing, headers and bodies, or replay it.
The Request logs page (/modules/api/logs) lists every captured request, newest first.
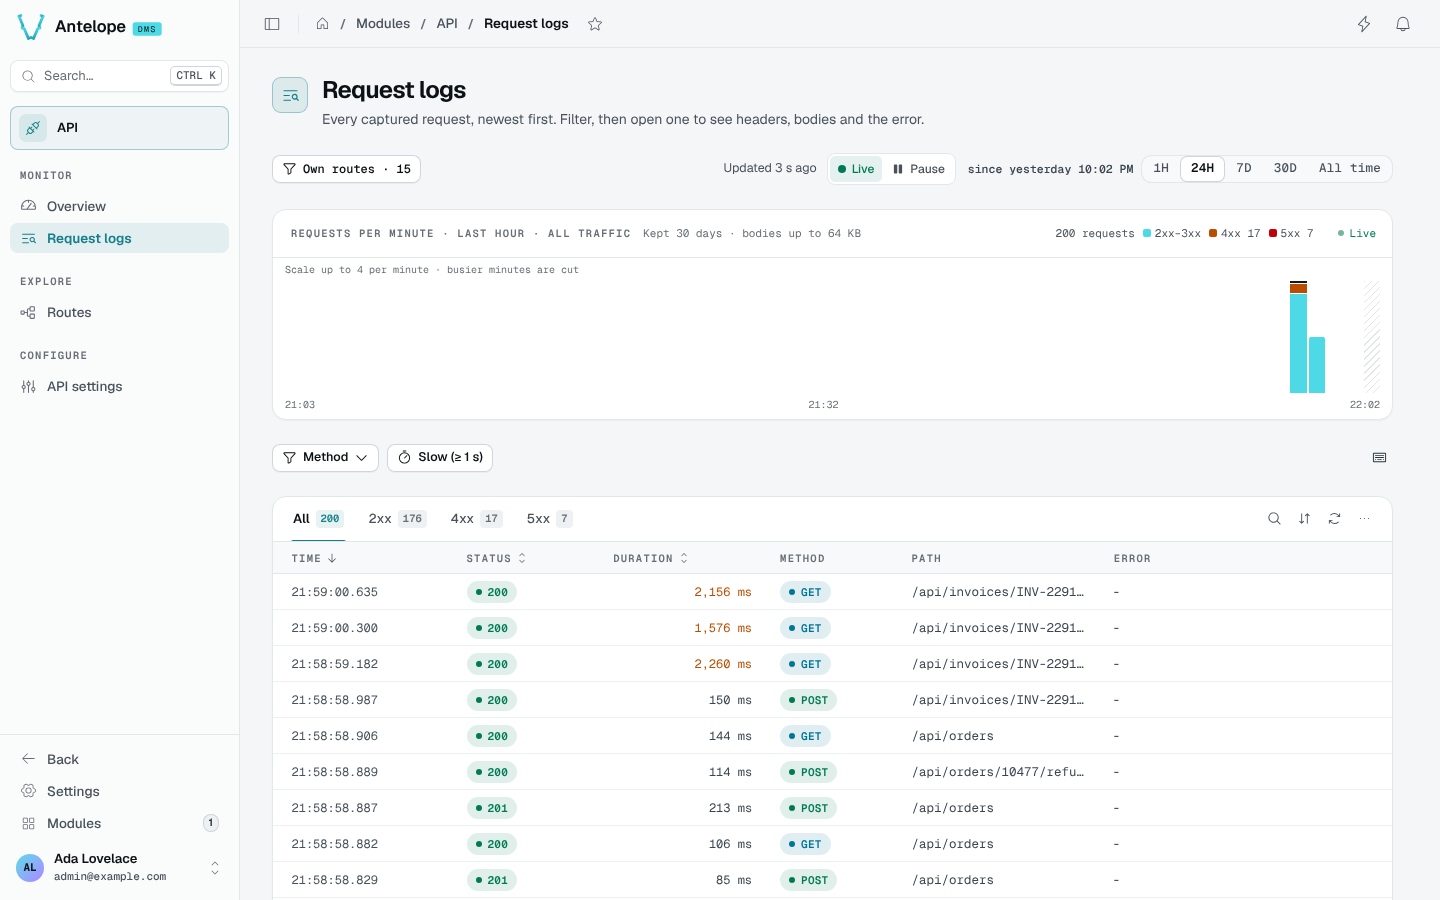
Filter
- The chart at the top shows requests per minute over the last hour, by status class, with the retention and body cap in use.
- The tabs filter by status class: All, 2xx, 4xx, 5xx, with their counts.
- Method and Slow (≥ 1 s) narrow the table further; the slow filter follows your slow threshold.
- The period selector adds All time to 1H, 24H, 7D and 30D.
/opens the search, and?lists the shortcuts.
Open a request
A single click on a row opens the request in a side panel on the right. The panel is titled with its method and path; J and K step through the rows shown, and the URL names it (?record=<id>), so a link or a reload opens it again.
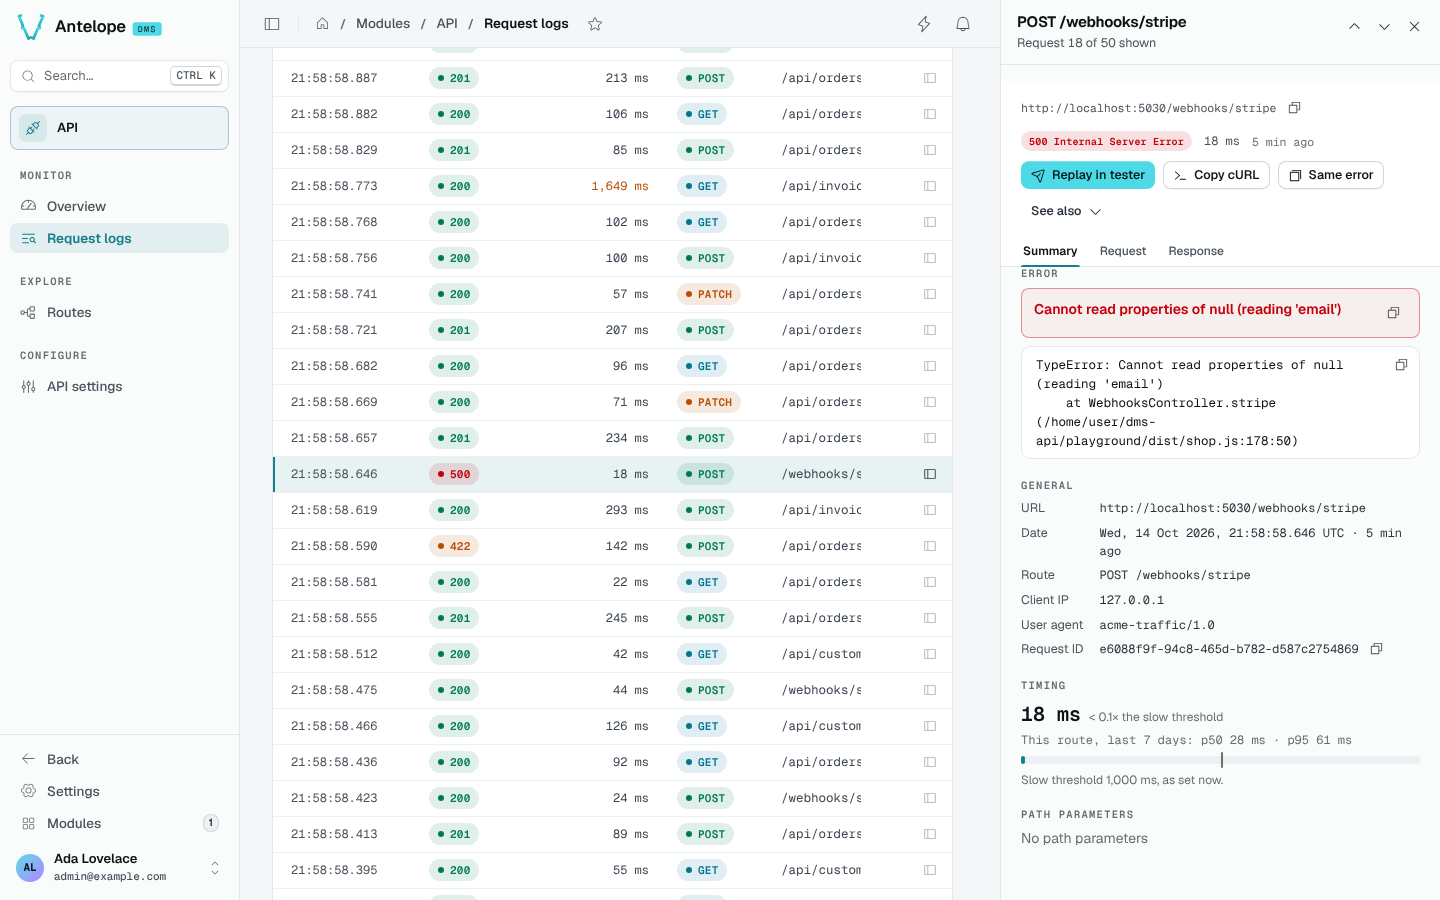
The panel has three tabs:
- Summary: the error and its stack, the general facts (URL, date, route, client IP, user agent, request ID), the timing compared with the route's p50 and p95, and the path parameters.
- Request: the captured headers, query string and body.
- Response: the status, headers and body.
From the panel, Replay in tester opens the route's Tester filled with the request, Copy cURL copies it as a command, and Same error lists the other requests that failed the same way.
Bodies above the body cap are stored truncated and flagged, and secret-looking values are stored as
[REDACTED]. See Data handling.