Overview
The Overview (/modules/api/overview) answers one question first: is the API healthy, since when, and why not.
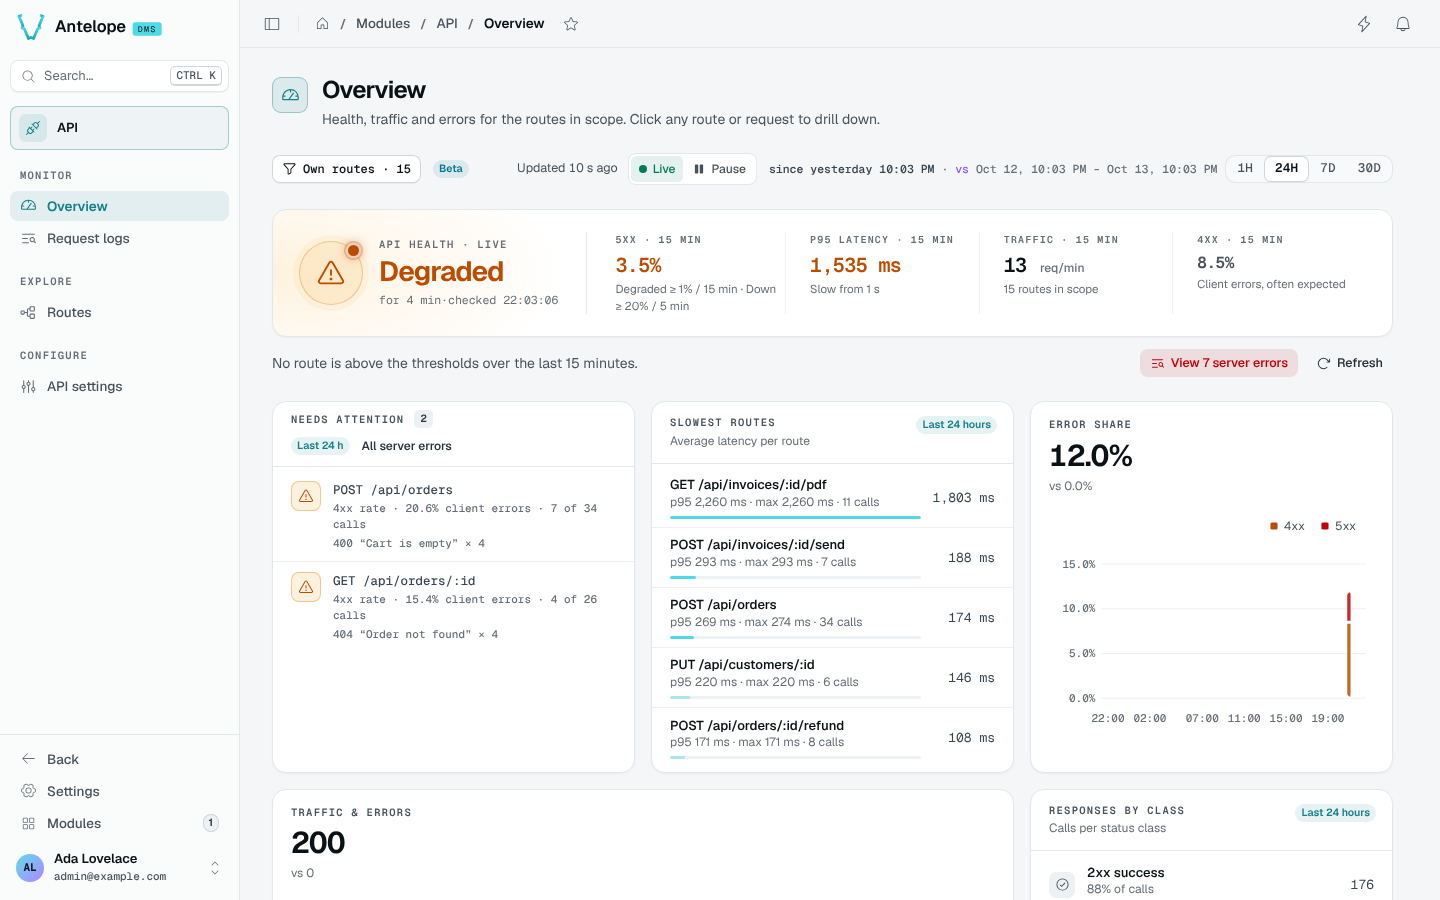
Health verdict
The hero card shows the verdict (Healthy, Degraded or Down), how long it has held and when it was checked, next to the four signals it is computed from over the last 15 minutes: the 5xx rate, the p95 latency, the traffic in requests per minute and the 4xx rate. The API is Degraded from 1% of server errors over 15 minutes and Down from 20% over 5 minutes.
Under the hero, a sentence names the routes above the thresholds, and View server errors opens the Request logs narrowed to them.
Blocks
| Block | What it shows |
|---|---|
| Needs attention | Routes that are failing (5xx), slow (p95 at or above the slow threshold) or noisy (many 4xx), with their main error. |
| Slowest routes | Routes ranked by average latency, with p95, max and call count. |
| Error share | The share of 4xx and 5xx over the period, compared with the period before. |
| Traffic & errors | Calls over time, with errors. |
| Responses by class | Calls per status class (2xx, 3xx, 4xx, 5xx). |
Every route and request is a link: a route opens in Routes, a request in its side panel, and an incident opens the Request logs narrowed to its own range (?since=&until=).
Period and scope
The period selector (1H, 24H, 7D, 30D) sets what the blocks cover and compares it with the period before. The period is kept in the URL (?api.period=last-24h); without one, a page opens on the last period picked on any of the three pages, else on the last 24 hours.
The scope chip (Own routes · 15) shows which routes the console watches. Change it on the API settings page.
Live mode
The Overview, Request logs and Routes share the DMS Live / Pause toggle (L):
- Live (the default): the page follows new requests as the DMS realtime channel announces them. Each block reads again at most every 5 s (Request logs), 10 s (Overview) or 15 s (Routes), every minute once a page shows a week or more, and on that clock while the realtime channel is down.
- Paused: nothing is read. The toggle says what was missed ("Paused · 40 new requests · 2 in 5xx"), the request tables keep their rows and offer "40 new requests · 2 in 5xx · Show". Resuming reads each block once.
The page also pauses by itself while its browser tab is hidden and while you type in the Tester. A request table holds its rows while one of them is open in the side panel and says why ("Table on hold · search active"). The choice applies to all three pages; ?live=0 opens a page paused.